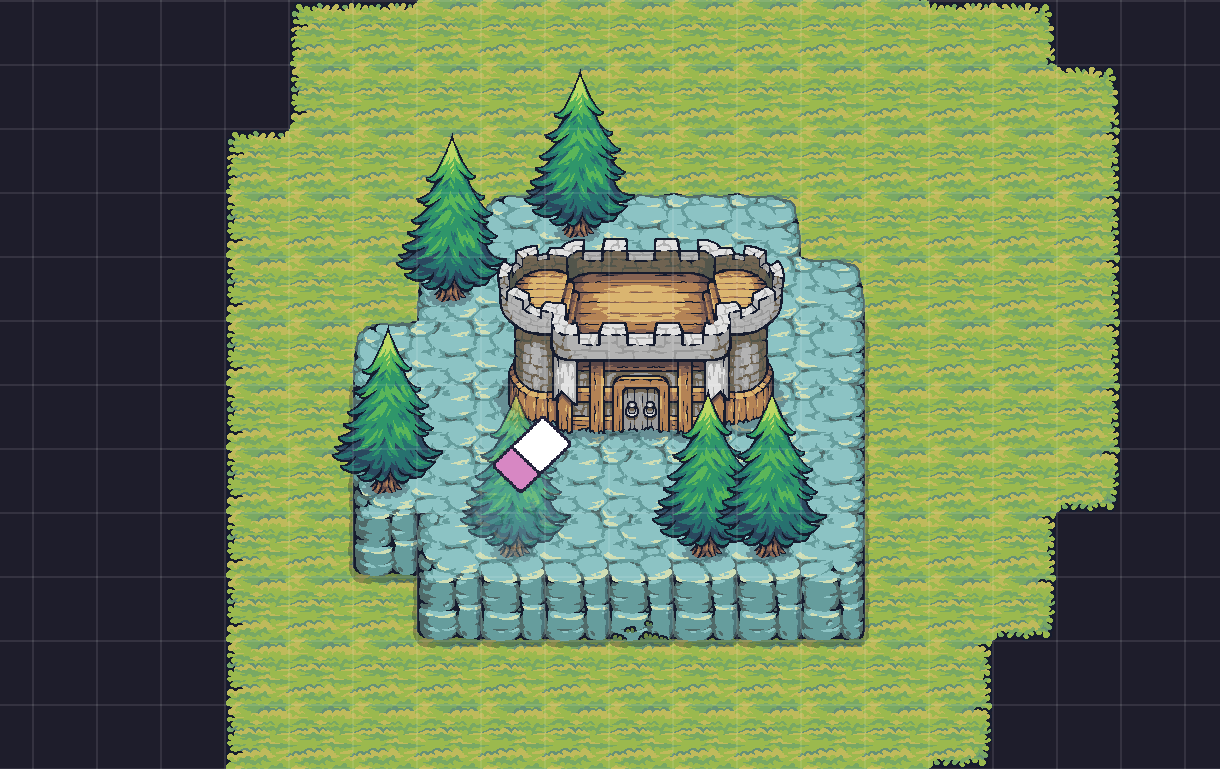
Shaving Millions of Tile Lookups Off The Eraser Overlay
When you grab the level-editor eraser you probably aren’t thinking about big-O notation, but our frame profiler definitely was. Every hover tick the overlay code walked every tile in the level to locate the doodad under your cursor. On large maps that meant thousands of getTile calls per frame—before we even drew the highlight rectangle. This post walks through how we turned that O(rows × cols) scan into a constant-time lookup and why it matters for tool responsiveness.
The Original Hot Path
for each row:
  for each col:
    const doodadCode = level.getTile(col, row, LayerIdV2.Doodad)
    if doodad overlaps mouse:
doodadAtMouse = true- The loop ran every render frame while the eraser was active.
- On a 200×200 canvas that is 40,000 tile fetches per hover update.
- At 60 FPS we were asking the level system for ~2.4 million doodad samples every second, even if the mouse wasn’t moving.
- The work scaled quadratically with map size; doubling rows and columns quadrupled the cost.
Strategy: Precompute Doodad Footprints, Query Locally
- Visual footprint cache — At load we iterate
codeToTileMaponce and record each doodad’s:- visual width / height in tile units
- horizontal and vertical offsets (wide doodads are centered, tall doodads are bottom-aligned)
- Search window — While precomputing footprints we also derive the maximum horizontal and vertical reach any doodad can have relative to its logical anchor. That gives us constant bounds (≈ a 3×4 window in practice).
- Per-frame lookup — When the eraser needs to know “is there a doodad under the cursor?”, we only sample doodad anchors inside that small window, compare their cached footprints against the cursor, and bail as soon as one matches. No more full-level sweeps.
function doodadCoversTile(level, tileX, tileY):
  for anchorY in [tileY - verticalRadius, tileY + verticalRadius]:
    for anchorX in [tileX - horizontalRadius, tileX + horizontalRadius]:
      const code = level.getTile(anchorX, anchorY, LayerIdV2.Doodad)
      if footprintCache[code] covers (tileX, tileY):
        return true
  return false
Results
| Scenario | Before | After |
|---|---|---|
| 100×100 map @ 60 FPS | 600k tile lookups / sec | ~3k lookups / sec |
| 200×200 map | 2.4M lookups / sec | ~3k lookups / sec |
| Complexity | O(rows × cols) | O(1) |
Because the cache lives at module scope we only pay the footprint math once per session. Every subsequent hover just performs a handful of cache lookups and array comparisons. Subjectively the eraser overlay now tracks the mouse without the micro-stutters we saw on large authored maps, and objectively the frame-time spikes in EffectsRenderer.renderEraserOverlay disappeared from the profiler flame graph.
Takeaways
- Tooling code runs in the same render loop as gameplay, so seemingly “cheap” logic can be a frame killer when it scales with map size.
- When placement visuals can be wider/taller than a single tile, caching their projected footprint is often cheaper than recomputing offsets on every hit-test.
- Investing in small spatial indices—even a fixed-radius window—is usually enough to turn input-driven scans into predictable constant-time work.
Next up we’ll apply the same philosophy to placement previews and doodad z-ordering so more of the editor’s frame budget goes toward drawing, not searching.
